
Student Voter Registration
Our statistics on voter registration rates come from the report published by the National Study of Learning, Voting and Engagement (NSLVE), a study conducted by the Jonathan M. Tisch College of Civic Life at Tufts University. Every two years NSLVE publishes a report to inform institutions of higher education on the voting habits of students across America. Participants in the survey range across more than 1,200 campuses throughout all 50 states.
Our Data
Check out the report conducted by NSLVE on the University of Iowa's voter registration rates in the presidential and midterm elections.
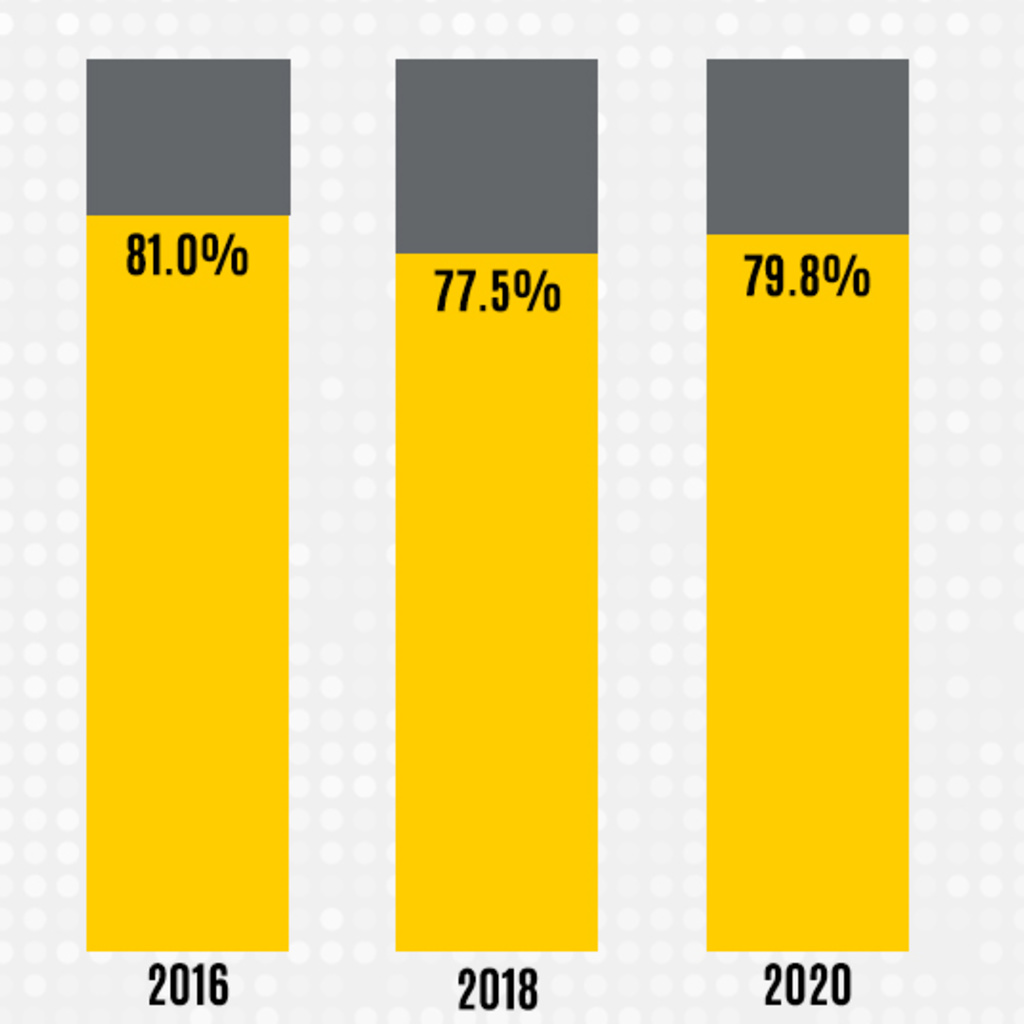
Registration Rate
The registration rate is the percentage of voting-eligible students who registered to vote. In the 2020 election, our registration rate increased from 2018.
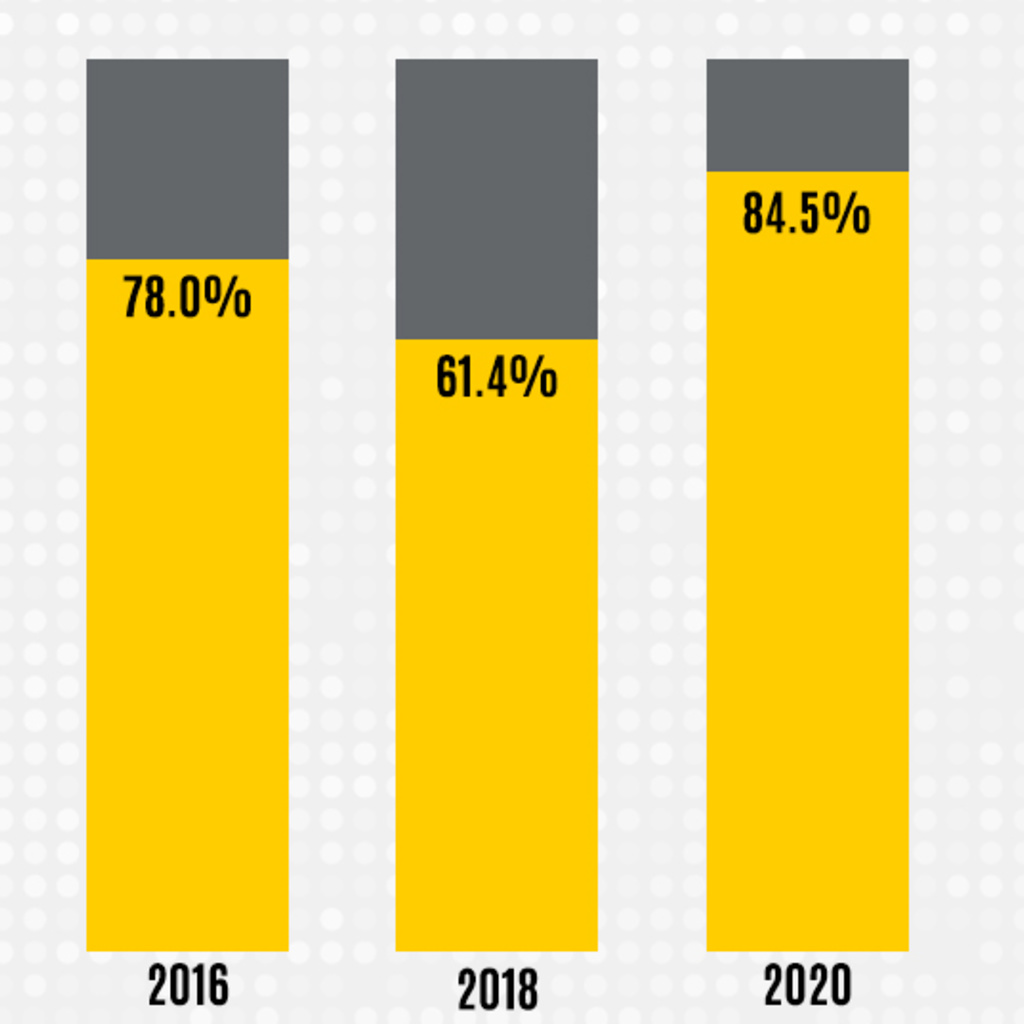
Student Voting Rate
The voting rate of registered students is the number of students who voted on Election Day. The yield rate is the number of students who are registered to vote that went to the polls. In the 2020 election, students voted in higher numbers compared to previous years.
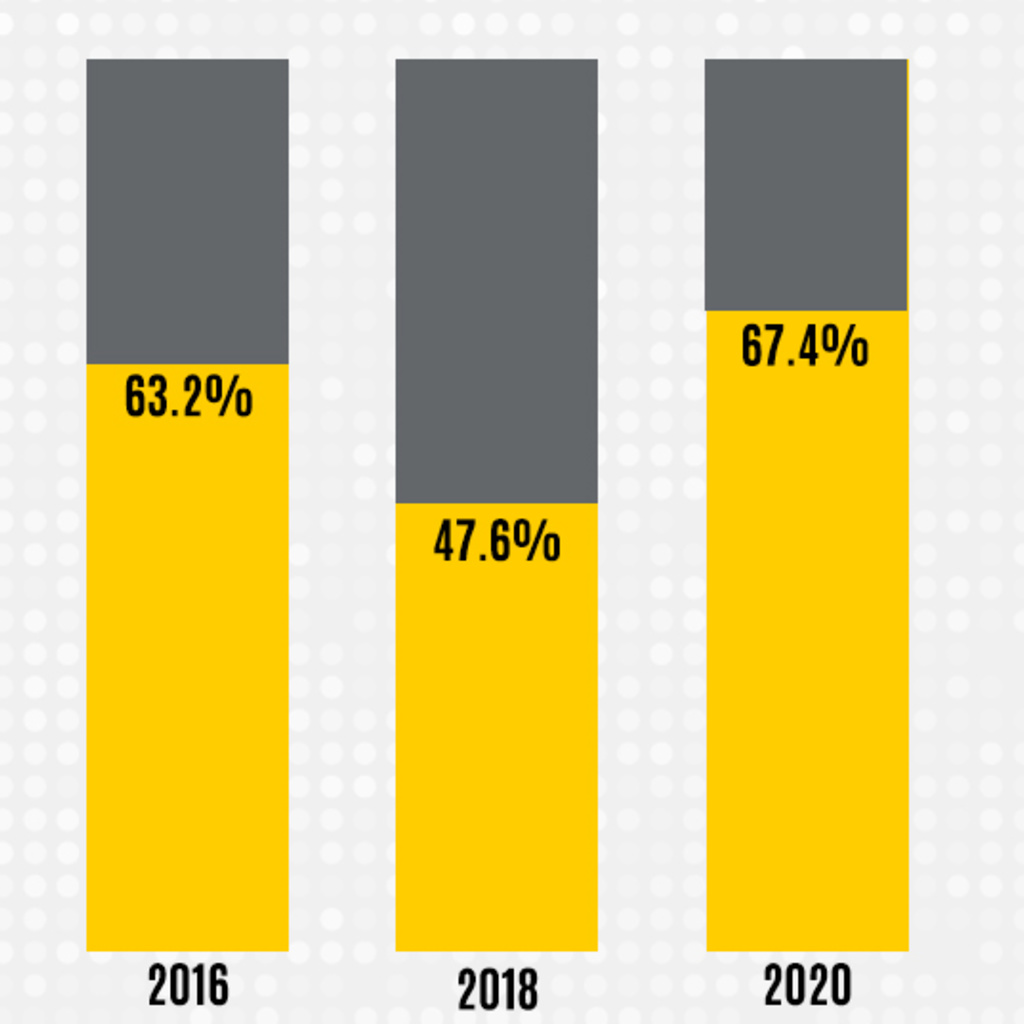
Overall Voting Rate
The overall voting rate is the percentage of eligible
students who voted on Election Day. The voting rate
is also the product of the registration and yield rates. Iowa was at 67.4% compared to the national average of 66%.